01
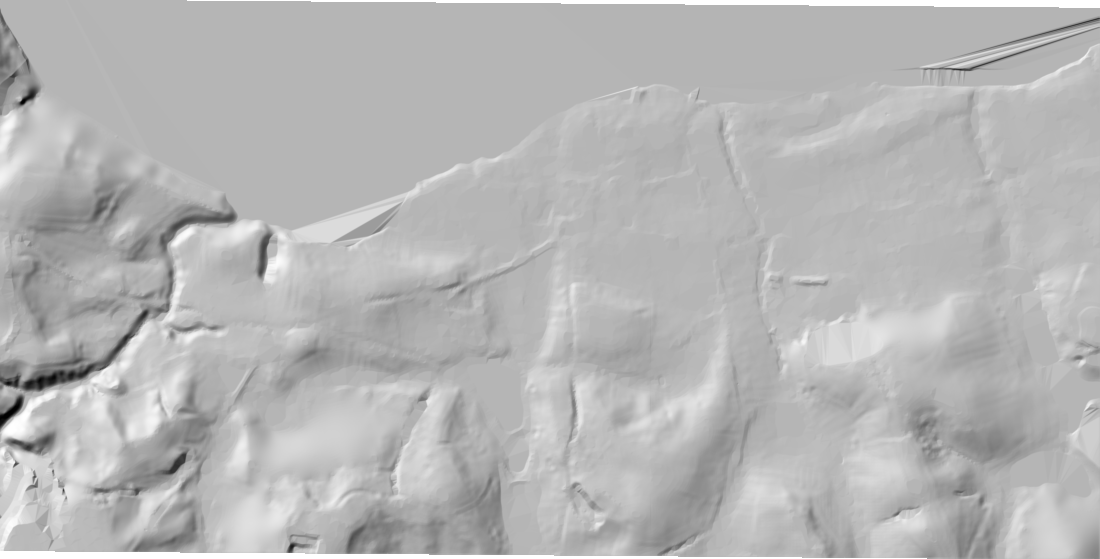
Begin with terrain
The land is not a flat buffer
Across this compact test area, elevation changes from 128 to 216 metres. The one-metre DEM lets the method examine those changes close to the shoreline.
Scroll over the map to zoom; drag to pan after zooming. Select a coloured zone for details.
02
Map the evidence
Water is a network, not one line
The source contains 42 polygonal and 10 linear water features. Their geometry becomes the common reference from which distance and terrain are measured.
42 + 10polygon and line features
03
Expose the parameter
First, test a visible 50-metre width
The source attributes do not legally classify each water object. I therefore use 50 metres as an explicit test setting, not as a claim about the correct statutory width for every feature.
0.756 km²standard screening area
04
Read the slope
Extend only where the terrain test triggers
At the 50 m ring, the method compares terrain height with the nearest shoreline. Shoreline pixels linked to a slope above 3° extend the analytical band toward 100 metres.
1,709flagged shoreline pixels
05
See the difference
The extension is selective
The rust-coloured areas are not a second uniform buffer. They appear only where the terrain condition is met, adding 0.411 km² to the screening picture.
0.411 km²terrain-triggered extension
06
Keep the protocol open
A result should carry its evidence
The archive, individual inputs, derived layers, QGIS model, theory note, metadata, checksums and reproducibility script are published together. The map is an entry point, not a sealed conclusion.
Open the GitHub source →